Explainer: what is drought?
01 August 2019
The effects of drought can be distressing—particularly in agricultural areas and on the environment—and can affect the whole community. So, what causes drought, is it becoming more frequent and how can you track whether your area is affected?
Drought is a prolonged, abnormally dry period when the amount of available water is insufficient to meet normal use. To understand when droughts are occurring it's necessary to know how much water is around and how that compares to normal conditions.
Video: Understanding drought.
At the Bureau, we closely monitor the amount of rain Australia receives. Our climatologists report on this, including when areas are receiving less rain than usual.
To understand how current rainfall relates to 'normal' conditions, we compare apples with apples. That is, we compare it to rainfall in the same area, at the same time of year using gridded national analysis of records going back to 1900. We analyse rainfall totals over at least a three-month period—analysis over these longer timescales provide a clearer indication of rainfall trends that may be significant.
All the rainfall totals since 1900 for these periods are ranked in order from driest to wettest. Rainfall totals in the lowest 10 per cent are considered to be in 'deficiency'. If rainfall is in the lowest 5–10 per cent, the area is in 'serious' deficiency and if it's 0–5 per cent, it's in 'severe' deficiency.
If below-average rainfall continues over months and years, water storages are depleted. Dam and reservoir levels drop. The soil dries, river levels lower (some may dry up completely), and groundwater levels fall.
Our hydrologists model soil moisture, forecast and measure streamflow, supply groundwater data, and provide information about water resources that contributes to understanding the bigger drought picture.
What causes drought?
Put simply, drought occurs when there's not enough rain. In Australia, we have highly variable rainfall—after all, we're famously a land of 'droughts and flooding rains'. A lot of this variation—but not all—can be explained by what's happening in the climate system. Australia's climate is affected by a number of different drivers and some of them influence rainfall.
El Niño–Southern Oscillation (ENSO) and the Indian Ocean Dipole (IOD) are two major drivers of Australian rainfall—and an El Niño and positive IOD occurring together can reinforce each other’s drying effects. It should also be noted that while El Niño is often associated with low rainfall, it isn't always the case.

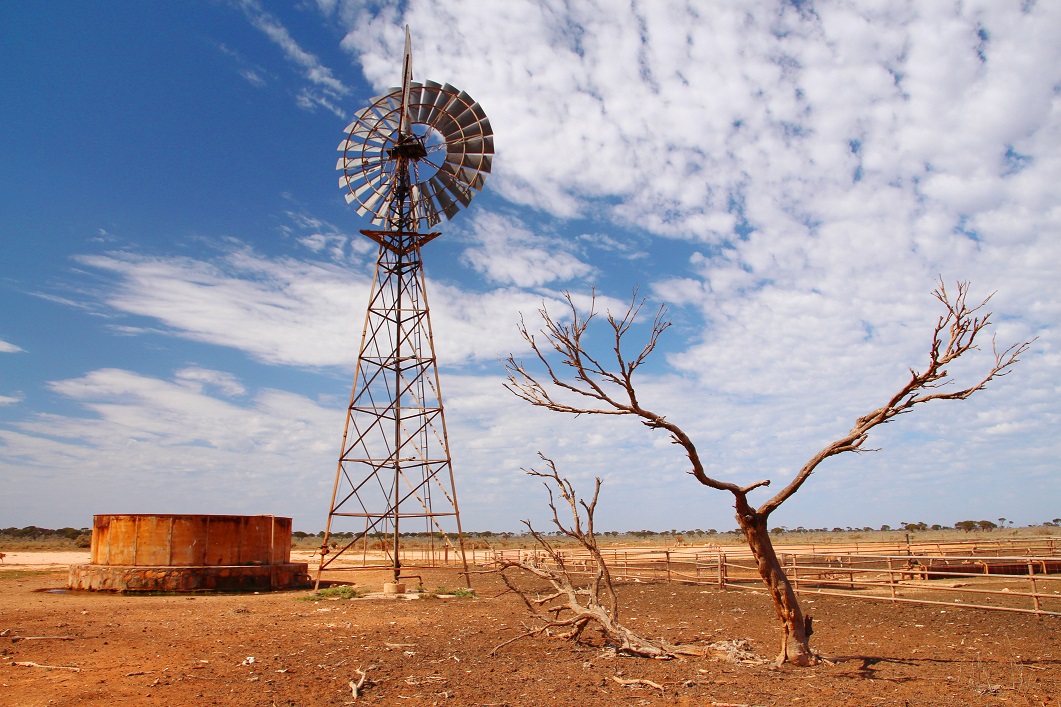
Image: drought in Australia.
Is climate change making drought more likely?
Yes—in southern Australia. The State of the Climate report produced by the Bureau and CSIRO shows that for many regions there will be more time spent in drought, with a decrease in cool-season rainfall over coming decades. This is associated with a shift in the track of rain-bearing fronts so they now occur further south, rather than affecting Australia.
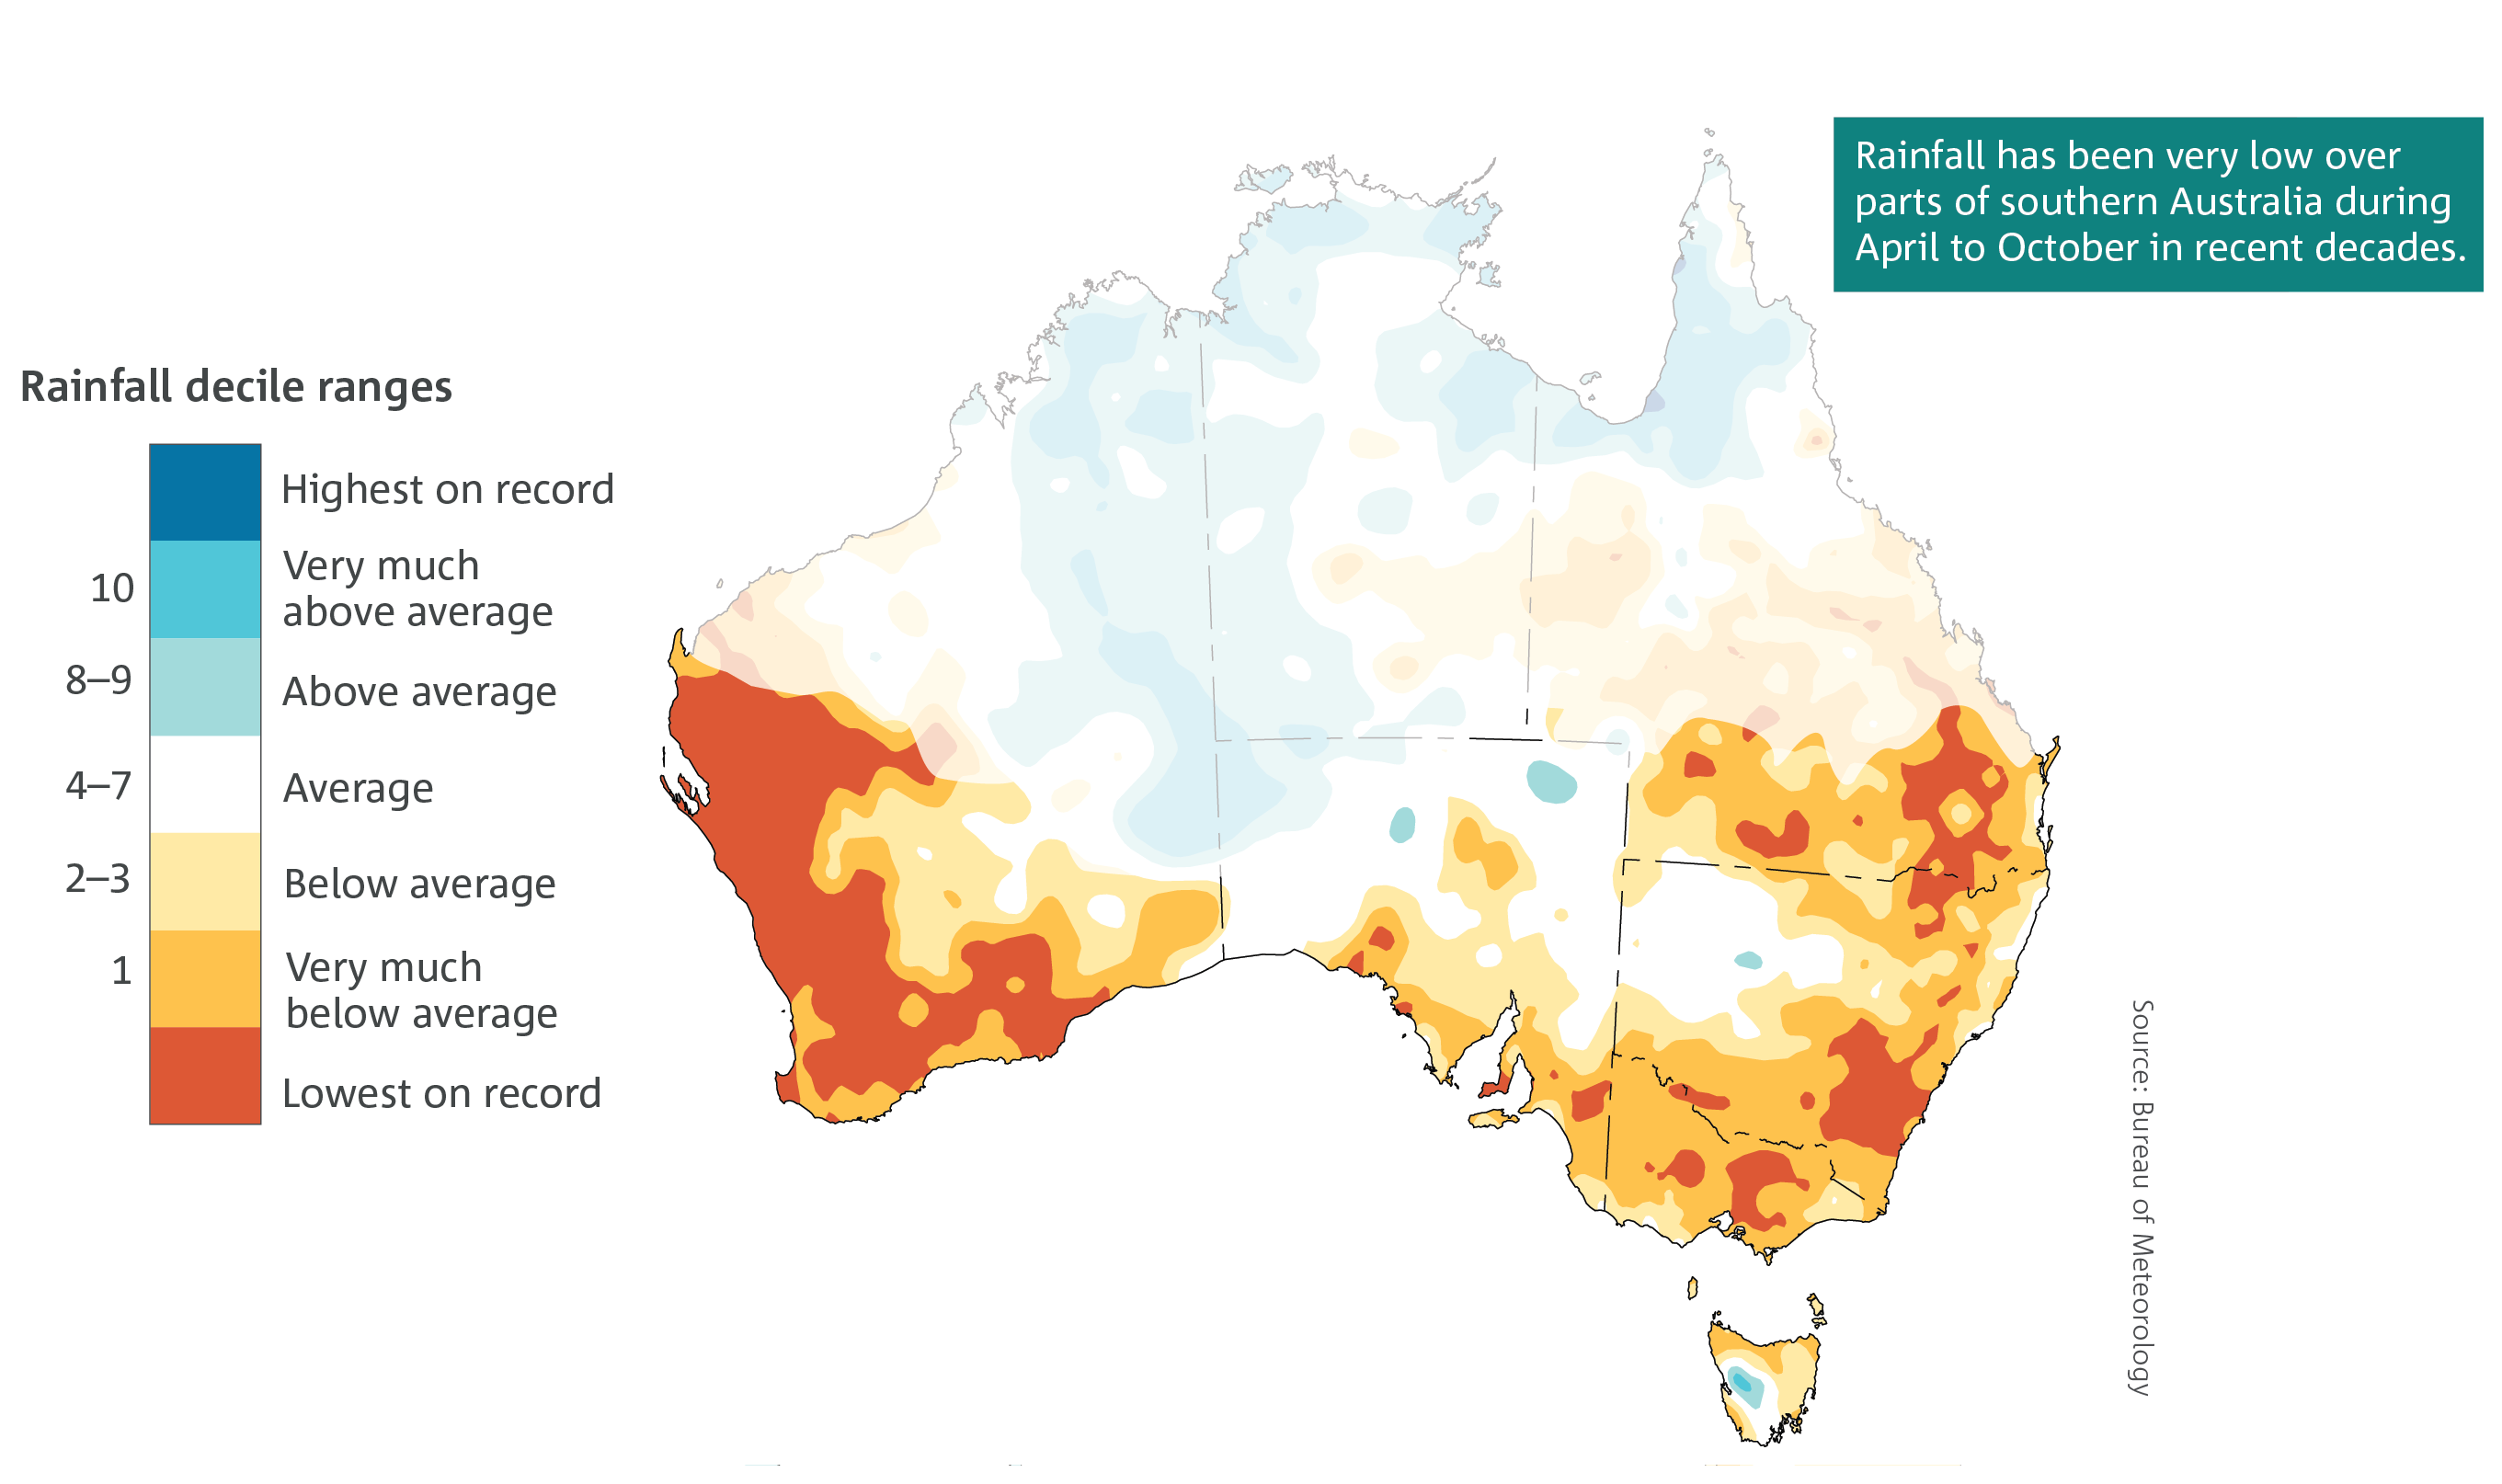
Since the 1970s there's been a strong trend of lower rainfall in southwestern Western Australia in the cooler months, especially over May–July. In the southeast we've also seen a change from the late 1990s. In southwest Western Australia, the impact of the shift in fronts was seen earlier because these were the primary source of rain in the cooler months. In southeastern Australia, the impact wasn't as marked initially because rainfall there comes from more varied sources, such as northwest cloud bands coming from the tropics and cut-off low pressure systems.

Map: April to October rainfall deciles for the last 20 years (1999–2018). Areas across northern and central Australia that receive less than 40 per cent of their annual rainfall during April to October have been faded.
The decrease in rainfall, with the decrease in the number of very wet years, means it's becoming harder to properly recover from drought, in terms of replenishing water reserves. This means that even though there may be enough water to meet short-term needs, we are more vulnerable if drought occurs again because we don't have the reserves to sustain us over periods of lower-than-average rainfall.
Increasing temperatures can also play a part in increasing the impact of drought, by exacerbating the intensity of dry conditions. Australia, along with the Earth as a whole is warming because of increased greenhouse gases such as carbon dioxide and methane in the atmosphere. The shift in average temperature means we are seeing more extreme weather, including temperature extremes.
Can drought be forecast?
Our Climate Outlooks show whether rainfall is likely to be above or below average for the coming months and season ahead. We also consider the current conditions when we're communicating the outlook. If it's already dry and soil moisture is low, the actions taken using the outlook may be different from when there's plenty of water around.
Can you compare one drought with another?
Every drought is different. Droughts can vary in intensity (how much rain doesn’t fall), the size of the area that's affected and how long they last. They're also accompanied by different temperatures and prior water availability. Their impacts can vary markedly too, on resources and the number of communities they affect. With so many variables it's hard to say one drought is overall 'worse' than another—each can impact in different ways and at different timescales.
However, you can look at various aspects of droughts and compare those. For instance, how large is the area affected? Has the drought been accompanied by high temperatures? How long have the drought conditions lasted?
The value of making comparisons lies in identifying how unusual current conditions are and in helping to understand trends, which inform plans for the future. For example, the long-term drying trends across southeastern and southwestern Australia mentioned above, which have helped to increase focus on the use and availability of climate resilient water sources.
How much rain does it take to break a drought?
The drought isn't over until people have enough water to meet their needs—and it's no easy matter to convert that to how much rain might need to fall.
There may be enough rain to keep a flush of green growth in the landscape, but still have the underlying soil too dry to grow enough pasture—this is sometimes called a 'green drought'. Or there may be sufficient rain at the right time of year to grow a crop, but not enough to replenish water storages. In some cases, it could take many months of above-average rainfall before enough water is available to meet needs. If the above-average rainfall occurs at the 'wrong' time of year—such as outside growing season for farmers—then it isn't a good indication of whether the drought is broken.
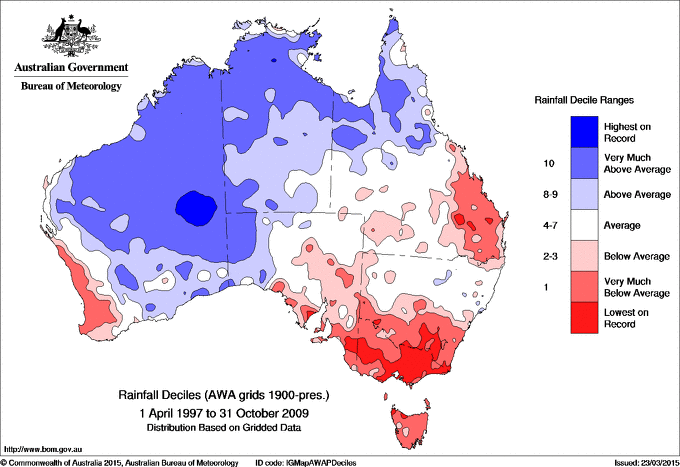
Even through the Millennium Drought (1997–2009), not every season was exceptionally dry. What really strung it together was that there were no 'recovery' years until 2010–2011, when two of the strongest La Niña events on record finally brought the 'flooding rains' part of the 'droughts and flooding rains' equation to life.

Map: Rainfall deciles for the Millennium Drought (1997 to 2009) showing below-average to record-low rainfall across much of southwest and southeast Australia.
Who calls it when an area is in drought?
The Bureau doesn't 'declare' drought. We provide information about rainfall deficiencies and water resources, but organisations and governments considering areas of drought may take other factors into account, such as community impacts, declining productivity or income loss.
The Australian Government offers drought assistance. There are also drought assistance contacts in each State and Territory.
How do I know what's going on with drought in my area?
- Head to the drought pages of our website.
- For the latest information about which areas are experiencing rainfall deficiencies and below-average soil moisture, read the Drought Statement (released monthly).
- National rainfall for the week just gone is shown in the Weekly Rainfall Update. It also covers the impact of recent rainfall on areas experiencing deficiencies.
- To see rainfall decile maps which can show you which areas are in the bottom 10 per cent of historical rainfall observations (select 'drought' in the 'map' drop-down menu), use the rainfall tracker.
- You can discover information about rainfall averages, variability and trends.
- You can also find links there to other related information, such as rainfall and temperature outlooks, Seasonal Streamflow Forecasts and soil moisture modelling.
More information
Subscribe to receive Climate Outlooks, the monthly Drought Statement and/or Weekly Rainfall Update by email.


Comment. Tell us what you think of this article.
Share. Tell others.